Time Patterns of Peromyscus Activity and Their Correlations with Weather
Gerald G. Marten
Journal of Mammalogy, Vol. 54, No. 1. (Feb., 1973), pp. 169-188.
For readability, some figures images may best be viewed via .pdf - Download .pdf (920kb)
Abstract
The activity of Peromyscus maniculatus in an Ontario forest and Peromyscus truei and Peromyscus californicus in California chaparral was observed directly and monitored electronically. The activity of all three species outside the burrow was pulsed through the night, with different individuals not in tight synchrony and a depression in overall activity in the middle of the night. Activity of P. californicus was similar to that of P. truei, but P. californicus had inaddition a pronounced burst of activity before dawn. As summer progressed, the amount of activity of P. maniculatus diminished and was compressed into the early part of the night. Wind and moonlight had no strong effect upon activity within a night.
From night to night, P. truei had conspicuous fluctuations in total nightly activity (at a period of about 4 days), the entire population usually being in synchrony. Night-to-night fluctuations in P. californicus activity were in phase with those of P. truei. Night-to-night fluctuations in vole tracks in Quebec (unpublished data from R. Bider) had low correlations with P. maniculatus tracks in the same area. Night-to-night fluctuations in P. truei activity had a positive correlation with barometric pressure and a negative correlation with low pressure weather variables (humidity, temperature). There was no correlation with wind or cloud cover. None of the weather variables had a strong periodicity at 4 days, but P. truei activity was in phase with the 4-day-component of barometric pressure, out of phase with temperature, and leading humidity. The evidence suggested that sundown temperature was the key variable.
Fluctuations in tracks of P. maniculatus (Quebec) had similar properties, except they were in-phase with low pressure weather variables. Vole tracks (Microtus pennsylvanicus and Clethrionomys gapperi) showed the same periodicities as weather and were tightly correlated with weather.
Most information on small mammal movements comes from trapping, which lacks continuity through time. It is apparent from the review of activity of deer mice by Falls (1968) that, aside from a few studies based upon tracking (Blair, 1951; Falls, 1953; Bider, 1968) or photographic recorders (Carley et al., 1970), little is known about time fluctuations of deer mouse activity in the field.
In the study reported below, movements of deer mice were monitored continuously for 6 months in two areas of different climate and vegetation. Discussed below are general features of activity patterns within each night, periodicities which predominate in activity fluctuations from night to night, and correlations of the activity fluctuations with fluctuations in weather.
Methods
Individual mice were implanted with miniature transmitters recording on separate channels. The transmitters registered only when mice carrying them passed over antenna wires lying on the ground. The entire population, including mice never captured and implanted with transmitters, was monitored by means of aluminum tapes lying on the ground. They detected all mice by conductance whenever stepped on by mice passing over them. Details of design of the transmitter and aluminum tape detection systems may be found in Marten (1972).
Ontario Site
In September 1967, 2500 feet of aluminum tape were placed in beech forest with maple understory located at Petawawa Forest Experiment Station, Chalk River, Ontario, Canada (Figure 1). Activity records were obtained from May to October 1968. Nearly all nocturnal activity was due to Peromyscus maniculatus and all diurnal activity was due to Tamias striatus, although Clethrionomys gapperi and Napaeozapus insignis were also present in small numbers.
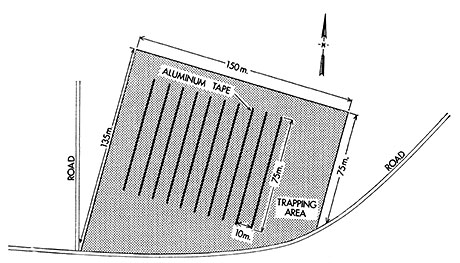
Figure 1 - Layout of the study area at the Ontario site (Petawawa Forest Experiment Station, Chalk River, Ontario). The aluminum tapes were lying on the ground and detected mice that stepped on them while passing over.
There were only a few P. maniculatus in the study area when the snow cleared in May. Numbers increased to about 30 by the end of June and remained there through July and August, with the same individuals continuing to inhabit the site. Numbers then rose to more than 50 by the end of September and dropped to less than 10 by the end of October, with none of the residents from midsummer remaining. The abrupt changes during autumn were due to local population migrations that preceded snowfall.
Throughout the summer of 1968, mice were observed directly as they moved about in the forest. Direct observation provided a familiarity with what kind of activity the aluminum tape was measuring, as well as a check on the nightly and seasonal patterns of activity recorded. A half-acre of nearby pine was cleared of hazel (Corylus) undergrowth to observe mice at night by means of hand-held, red spotlights. The 150-watt spotlights were covered with several layers of red cellophane and were dim. Mice did not seem to react to the light, though reflecting tape attached to their ears with ear tags was easily visible throughout the cleared area.
California Site
In March 1969, 500 feet of antenna for transmitter reception were placed in chaparral at the University of California's Russell Reservation near Lafayette, California (Figure 2). Four hundred feet of the aluminum tape were placed on the area in June.
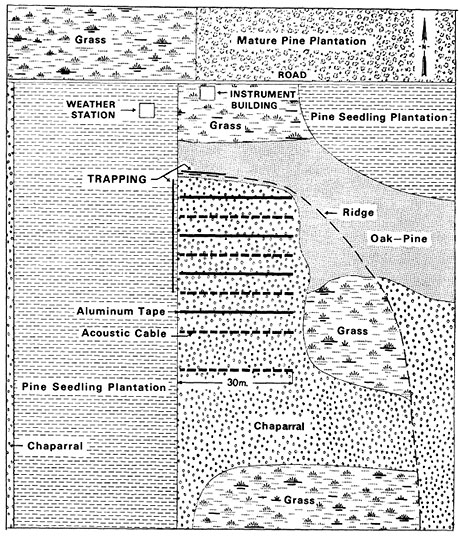
Figure 2 - Layout of the study area at the California site (Russell Reservation, near Lafayette, California). Antennas lying on the ground, which detected transmitters inside mice as they passed over, were at the locations labelled acoustic cable.
The chaparral is on a 50 per cent slope covered with Baccharis and Rhus. The ground has a fine layer of litter and no herbaceous vegetation except at the edges of the chaparral. The study area was live-trapped on only a few occasions, from February to September 1969. Of 12 P. truei captured in February, eight were present throughout the spring and summer and received transmitter implants in April. Four P. californicus in the area in May received transmitter implants, but only two remained through the summer. No other Peromyscus appeared in the area during the spring and summer except for one juvenile at the end of May and five juvenile P. truei and one P. californicus in July.
Temperature, relative humidity, and wind were recorded at a standard weather station near the edge of the chaparral (Figure 2). Water vapor pressure was calculated from temperature and relative humidity. Barometric pressure was taken from records at Buchanan Field (Concord, California), about 10 miles away. Cloud cover was based on records at Buchanan Field supplemented by direct observations at the site (some instances of high fog may have gone unrecorded).
Detailed and continuous records from transmitters, aluminum tapes, and weather instruments for the period of May to September 1969 may be found in Marten (1970).
Individual Peromyscus truei also were observed directly in a 10-meter-square enclosure that included their burrows. The enclosure was illuminated by red light 24 hours a day.
Activity Patterns
Individual Activity Within a Night
Behney (1936) monitored the movements of Peromyscus leucopus in an outdoor cage and found about four bouts of activity outside the nest box each night, separated by periods inside the nest box. Orr (1959) recorded the movements of P. leucopus in an outdoor enclosure and likewise observed bouts of activity during the night. Isaac (1967) observed caged P. maniculatus to engage in one type of activity (such as wheel-running, drinking, or sitting) for a period and then switch completely to another activity.
A number of studies on wheel-running in caged Peromyscus have reported activity to be continuous throughout the night, rather than in bouts (Falls, 1953; French, 1956; Kavanau, 1962; Kavanau and Rischer, 1968). However, wheel-running in a cage probably does not correspond to activity outside a burrow in the field, because a cage gives a mouse only one alternative, whereas a mouse in nature divides its activity between the burrow and the surface. It is interesting to note that wheel-running of P. crinitus was discontinuous when individuals were given the opportunity to run in a complex maze attached to their cage (Brant and Kavanau, 1965). Possibly continuous wheel-running in cages is a repetitive, stereotyped activity of the sort described by Hediger (1950) for maladjusted zoo animals.
Pulses of activity have been observed in nocturnal Apodemus sylvaticus by Kikkawa (1964), who followed radiotagged individuals in the field, and in Apodemus flavicollis by Bergstedt (1965), who recorded movement between a nestbox and an outdoor enclosure. Radio-tagging studies also have shown pulses of activity in voles--Clethrionomys glareolus in the field (Kikkawa, 1964), and Microtus pennsylvanicus in the field (Ambrose, 1966) and in large outdoor enclosures (Graham, 1968).
In this study, direct observation of Peromyscus maniculatus in the forest and P. truei in the enclosure indicated the mice emerged shortly after dark, remained out for several hours, and then disappeared for a while. Burrows monitored for the presence of a transmitter-carrying mouse were visited by the mouse several times an hour during its activity period, each visit lasting several minutes. The transmitter signal indicated the mice were moving about in the burrow during the visits, as well as during their more prolonged stays in the burrow. They did not move about during the day, but movement began in the burrow about a half-hour before actual appearance on the surface.
When out of their burrows, the mice sometimes bounded from one part of the forest or enclosure to another but more often ambled about in an apparently random fashion. (If they were doing anything purposeful, such as gathering food, it was not revealed even by close observation.) Peromyscus truei in the enclosure sometimes took up stations near their burrow entrance, where they sat for long periods. P. maniculatus in the forest often travelled in pairs, particularly in the vicinity of the nest. P. truei in the enclosure seldom wandered about together, although pairs slept together in the nest during the day and sat outside the burrow together at night.
Records of individual P. truei carrying transmitters in the field showed several periods during the night when they were crossing antennas, separated by periods when they were not. Although mice may be active while in their burrows, activity as used in this report will henceforth mean travelling outside the burrow and being detected by electronic cables.
There was little activity during daylight from May to September at the California site. Transmitter records showed occasional activity in the morning, however, and a P. truei was once observed running through the chaparral on an overcast morning in June.
Population Activity Within a Night
If the activity of several individuals is added together, as in the transmitter records for four P. truei in Figure 3, the discrete pulses of individual activity are not so conspicuous, but periods of greater and lesser activity still remain. A first peak tends to occur within a few hours of nightfall, and the time of a second peak, which may be strong, is variable. There is usually a period of inactivity for the entire group, lasting 1or 2 hours, somewhere between 11 PM and 3 AM.
Figure 3 - Hourly counts from transmitters (top) and aluminum tape (bottom) in California chaparral (1969). The bars above the tics give the counts between 11 PM and midnight (Daylight Saving Time). The vertical arrows give the time of moon rise (pointing up) or moonset (pointing down). Sunrise times were about 6:15 AM (top) and 7:00 AM (bottom); sunset times were about 8:10 PM (top) and 8:50 PM (bottom).
Note that the timing of peaks and troughs often is similar on successive nights and becomes less similar as additional days intervene. Kavanau and Rischer (1968) found a similarity in the time of wheel-running in P. polionotus during adjacent nights, and the records of Behney (1936) on P. leucopus movements in and out of a nest box also showed similar timing of activity bouts on successive nights.
The number of counts registered by transmitter-bearing P. californicus is much lower than for P. truei. I do not know whether individual P. californicus actually were less active, or whether they moved about in the branches of the chaparral more than did P. truei, thus by-passing the antennas on the ground. When counts are high, the pattern of P. californicus activity through the night is similar to that of P. truei, except a greater portion of the activity is in the hour or two preceding dawn. There are characteristically three pulses of activity during the night when counts are low, and the burst of activity before dawn turns up reliably even when P. californicus does not appear at any other time of the night.
Aluminum tape records give the summed activity of the entire population. In Ontario the aluminum tape was registering chipmunks during the day and mice at night, with a space of several hours at dusk and dawn when nothing was registered. At the California site, the aluminum tape was registering only mice during the night. Hourly changes on the aluminum tape at the California site (Figure 3) are not so abrupt as transmitter records, but the pulsed pattern remains, often showing itself as three peaks in the course of the night. The pulses are blurred on some nights because individuals are not in synchrony with each other, as Graham (1968) found for Microtus pennsylvanicus in the field, which were not synchronized except at dawn and dusk.
At the Ontario site, activity within a night (as measured by the aluminum tape) was similar from night to night (Figure 4), but altered markedly through the year. In the spring (May), there were three peaks in activity each night. By early summer (June), this was reduced to two peaks, and activity was increasingly compressed into the early portion of the night as the summer progressed. This truncation of activity was not associated with low temperature.
Figure 4 - Hourly counts on the aluminum tape at the Ontario forest site (1968). Hours of the day are as defined in Figure 3. Three P. maniculatus were removed on 27 May.
Frequency distributions of hourly activity, such as Figure 5, which sum many nights of mouse activity, characteristically have two peaks. Falls (1968) has discussed the bimodal pattern in his review of Peromyscus activity, and Hansson (1967) and Bergstedt (1965) found it in Apodemus flavicollis and Apodemus sylvaticus, which are Old World ecological analogues of Peromyscus. Rodents that are not strictly nocturnal, such as Clethrionomys glareolus (Kikkawa, 1964) and Sigmodon hispidus (Calhoun, 1946), also have bimodal daily activity patterns, although Graham (1968) noted the bimodal pattern of Microtus pennsylvanicus in the field was not retained in laboratory cages. There is sometimes only one peak, in the early evening, followed by a plateau of activity till dawn; this was observed by Falls (1953) when trapping forest P. maniculatus during short summer nights and by Pearson (1959) when photographically recording movements of nocturnal Reithrodontomys megalotis in grassland runways.
Figure 5 - Total counts for each hour of the day at the California site, May to June, 1969. Transmitters registered the activity of eight P. truei. The aluminum tape recorded the activity of the entire population of P. truei and P. californicus. Hours of the day are as defined in Figure 3.
Activity from Night to Night
Figure 4 shows that total activity on the aluminum tape at Petawawa in 1968 declined as the summer progressed, despite an increase in population density over the same period. The activity per individual therefore declined sharply. Part of this decline could be due to mice learning to avoid the aluminum tape, but simultaneous direct observations confirmed that both individual and population activity of P. maniculatus did in fact decline through the summer.
The amount of activity from each sex was not investigated systematically, but records from P. truei with transmitters suggest that females possibly were more active than males. This contrasts curiously with the general observation that male Peromyscus have larger home ranges than do females (Stickel, 1968), although size of home range is not necessarily correlated with amount of activity.
Figure 6 shows that total nightly activity at the California site fluctuated markedly from night to night. Spectral analysis was applied to the time series of nightly activity in Figure 6, and a summary of computational procedures is given in the appendix. Power spectral densities (Figure 7) are based on the fact that any time series of T samples can be decomposed into sinusoidal waves of length two times the sampling interval, three times it, and so forth. If each sinusoidal has the proper amplitude, the simple sum of all of them results in the original time series. The power density at 2 days, for example, is the relative strength of any 2-day fluctuation that underlies the overall pattern of fluctuation in nightly activity, and similarly for periodicities at 3 days, and so forth, up to 14 days in Figure 7.
Figure 6 -Weather and total nightly counts (8:00 PM to 6:00 AM Daylight Saving Time) for activity at the California site (1969). Circled N and F give dates of new and full moons respectively. Records labelled P. truei or P. californicus are based on transmitters in known mice or groups of mice. Barometric pressure is for 10:00 PM each night; vapor pressure is averaged from 10:00 PM to 2:00 AM; cloud cover is the greatest which occurred each night; sundown temperature was taken at 8:00 PM.
Figure 7 - Power spectrum of eight transmitter P. truei (May to June 1969) and the aluminum tape (August to September 1969) at the California site. Based upon the time series in Figure 6.
The record in Figure 6 is not long enough to estimate underlying periodicities with high precision. In particular, an estimate of power density at a period of one length is not independent of periodicities in the data at slightly longer or shorter periods. This error is nearly absent at short periods, such as 7 days or less, and more prominent at longer periods.
As realistic confidence limits for power densities cannot be computed, a graph such as Figure 7 must be interpreted with caution. Although details cannot be interpreted literally, broad features, such as positions of peaks and troughs, are reliable. It is therefore safe in Figure 7 to conclude that P. truei, carrying transmitters in California during May and June, had a peak periodicity at 4 to 5 days and that population activity on the aluminum tape during August and September had a peak periodicity at 3 to 4 days.
Bider has supplied unpublished data from a sandtrack in a Quebec forest; he described the site and technique elsewhere (Bider, 1968). As the total numbers of tracks each day reflect the total amount of activity for each species, they were analyzed to provide additional information on night-to-night fluctuation in activities of Peromyscus and voles. The record for 1964 is given by Bider (1968), and the record for 1966 is given by Thibault (1969).
Tracking records for Peromyscus maniculatus in Quebec show a peak periodicity at 5 days for June to September in 1966 and 1969 (Figure 8); but 1964 and 1965 have a peak at 8 or 9 days. Peaks also appear in the vicinity of 13 to 16 days. Clethrionomys gapperi and Microtus pennsylvanicus from the same area show a roughly similar pattern of periodicities (Figure 8), except the shorter periodicity is sometimes at 6 or 7 days.
Figure 8 - Power spectrum of mouse tracks (Peromyscus maniculatus, Clethrionomys gapperi, and Microtus pennsylvanicus) on the sand track in Quebec forest (June to September 1969), based upon unpublished data of R. Bider.
Caged Peromyscus (Dice and Hoslett, 1950; Brant and Kavanau, 1965) have shown little fluctuation in wheel-running from night to night. However, Stinson (1952) noted a peak in wheel-running by P. leucopus at the time of ovulation, which is once every 4 to 6 days (Clarke, 1936). Sidorowicz (1960) found the correlation of catch in Apodemus flavicollis was highest for trappings 4 days apart, suggesting a 4-day periodicity.
Weather and Activity
There seems to be a general observation that mouse captures are high on warm and cloudy nights, particularly when there is light rain. This has been reported for Peromyscus leucopus (Gottschang, 1952), P. maniculatus (Gentry and Odum, 1957), Apodemus flavicollis (Sidorowicz, 1960 ), and A. sylvaticus (Tanton, 1965). However, Haresign (1964) found the distance of capture of P. leucopus from their trapping centre was diminished at high temperatures and humidities. Studies in laboratory cages, for example Stinson (1952), Falls (1953), and Hart (1953), have uniformly concluded wheel-running in Peromyscus is reduced at temperatures above or below an intermediate range (about 10 to 20° C); within this range, activity decreased with rising humidity. In contrast, Orr (1959) reported high activity at high humidities for P. leucopus in enclosures, although little activity at humidities near air saturation.
Falls (1968) has concluded from wheel-running studies in cages (Stinson, 1952; Falls, 1953; Johnson, 1939), enclosure studies (Blair, 1943; Orr, 1959) and sand tracking in the field (Blair, 1951; Falls, 1953) that Peromyscus is most active at a light intensity intermediate between bright moonlight and complete darkness. Activity in open areas is greatest when there is no moon, but under dense ground cover it is greatest at half or full moon. When there is a forest canopy or an abundance of shadows, light intensity may have no effect at all. Owings and Lockard (1971) found the amount of nightly wheel-running in caged P. californicus to be negatively correlated with nightly duration of simulated moonlight; but the correlation was positive in P. eremicus.
There is little substantial information on the effect of barometric pressure, which is difficult to disassociate from other weather factors; but where it has been recorded, for example Stinson (1952), there has been no apparent effect.
Activity Within a Night
It is difficult to relate activity within a night to weather. Some elements of weather do not change much at all within a night; others, such as temperature, relative humidity, and barometric pressure, have a diurnal cycle that is too regular to reveal effects on activity. On the other hand, the timing of moonlight within a night changes as the moon rises or sets at a later hour on each successive night; the pattern of wind during the night also varies from night to night.
In the present study moonlight had no strong effect on P. truei within a night. If there was any effect at all, it was positive, as suggested, for example, by shifts in activity peaks that followed the rising of the moon (for example, Figure 3, 4 to 6 May), or troughs in activity after the moon set (21 to 28 May). However, as moonset was sometimes accompanied by an activity peak, it may be that changes in illumination stimulated activity.
No striking relationships between wind and activity are apparent, but activity peaks and troughs within a night seem to be negatively correlated with wind; and the first activity peak of the night seems to be delayed by strong wind in the early evening. Nonparametric sign tests (Siegal, 1956:68-75) were run on hourly changes in P. truei activity versus hourly changes in wind during the period 6 May to 23 June. Wind and activity can be expected to change in the same direction 50 per cent of the time if they are not related. In fact, they changed in the same direction 52 + 4 per cent of the time, indicating no association. However, mice may respond to strong winds even though their activity is independent of normal winds.
Activity from Night to Night - California
Variations in weather from night to night are more suitable for comparison with activity than variation within a night. Sign tests (Table 1) show activity of P. truei is negatively associated with sundown temperature and positively associated with relative humidity. Barely significant are barometric pressure and wind, which are positive, and minimum temperature and vapor pressure, which are negative; cloud cover is not significant. Simple correlation coefficients (Table 2), somewhat independent from sign tests, give the same picture, except wind is not significantly correlated. Partial regression coefficients (Table 3), which give the correlational effect of each weather factor upon activity, with the joint effect of all other factors removed, indicate vapor pressure and sundown temperature have strong negative effects, relative humidity and barometric pressure have weaker positive effects, and minimum temperature in itself has little effect at all. Effects attributed to barometric pressure may be, in fact, due to unmeasured factors correlated with barometric pressure.
Table 1 - Sign tests of association between P. truei activity (May to July 1969) and weather1
Barometric pressure |
.60 + .08 |
(24/40 ) |
Sundown temperature |
.29 + .10 |
(6/21) |
Minimum temperature |
.40 + .09 |
(11/27) |
Vapor pressure |
.39 + .09 |
(12/31) |
Relative humidity |
.63 + .08 |
(22/35) |
Wind |
.59 + .10 |
(13/22 ) |
Cloud cover |
.55 + .11 |
(12/22) |
1 The proportion of night-to-night changes in weather factors that were in the same direction as changes in activity, with one standard error. Shown in parentheses are the actual numbers from which proportions were calculated. Nights for which either activity or the weather factor did not show a significant change from the previous night were not tabulated.
Table 2 - Correlations between night-to-night mouse activity and weather (California, May to July 1969; Quebec, June to September 1969).
Table 3 - Standardized partial regression coefficients for the effect of weather upon night-to-night mouse activity. Abbreviations and dates are as in Table 2.
|
BP |
ST |
TD |
CC |
RH |
|
PM (Quebec) |
.09 |
.02 |
.09 |
.23 |
-.06 |
|
C (Quebec) |
.13 |
.19 |
-.12 |
.18 |
.02 |
|
M (Quebec) |
.05 |
.31 |
-.13 |
.05 |
.02 |
|
|
W |
BP |
ST |
MT |
VP |
RH |
PT (California) |
-.07 |
.10 |
-.17 |
-.02 |
-.24 |
.12 |
Temperature, vapor pressure, and wind constitute a group of intercorrelated weather factors that in turn are all negatively correlated with barometric pressure. That is, nights of low barometric pressure tend to be cloudy, humid, and warm. With partial regression, the total variation in activity due to weather is the sum of the independent effects of each factor plus combined effects due to their intercorrelations. The net effect due to intercorrelations of the independent variables can be enormous, as Mott (1966) has discussed for the determination of population change in insects. Therefore, the joint effect of a complex of high pressure or low pressure weather factors may be more significant than the effect of any one alone.
Examining the power spectra of different weather variables (Figure 9), sundown temperature and relative humidity have spectra similar to each other. Comparing their spectra with the activity spectrum of P. truei in Figure 7, they have a 4-day peak like Peromyscus, but it is not as strong as the 4-day peak in Peromyscus activity, and the major weather peak at 10 days is at a period where fluctuation in Peromyscus activity is lowest.
Figure 9 - Power spectra of weather at the California site (top) and the correlational contribution of each factor to total nightly P. truei activity (May to June 1969). Based upon the time series in Figure 6.
Apparently the periodicity of P. truei activity is not following weather; the period of 4 days is either innate or in response to some external factor not measured. However, the mice appeared to be responding to weather in phasing their 4-day cycle. This is because high coherencies, particularly with sundown temperature, vapor pressure, and relative humidity (Figure 9) indicate a regular phasing with the 4-day components of weather. Barometric pressure is completely in phase with activity (Figure 10), and temperature is completely out of phase. Activity leads vapor pressure, wind, and relative humidity by about 90° (that is, one day), which suggests it is responding positively to the rate of change of these factors.
Figure 10 - Phasing of the 4-day component of various weather factors with respect to the 4-day period of fluctuation in total nightly P. truei activity (May to June 1969). A full period of 4 days is 360°. Coherences are given as percentages.
This phasing applies to the record from May and June and could possibly be different at other seasons. However, spectral analysis of nightly aluminum tape counts during August and September yielded the same relationships of activity to weather.
Activity from Night to Night - Quebec
Simple correlation coefficients for tracks and weather in Quebec from June to September (unpublished data of Bider) are given in Table 2. Activity of P. maniculatus is not correlated with anything except cloud cover and sundown temperature. Cloud cover, sundown temperature, and relative humidity constitute a group of positively correlated variables which is negatively correlated with a second group consisting of temperature drop during the night and barometric pressure. The partial regression coefficients (Table 3) indicate that cloud cover has a strong positive effect; but that weaker positive effects of barometric pressure and temperature drop, which are negatively correlated with cloud cover, tend to counteract this, resulting in little net response of P. maniculatus activity to weather.
As in California, the power spectra for fluctuations in all weather factors in Quebec in 1969 (Figure 11) are different from the spectrum for Peromyscus maniculatus activity (Figure 8). Weather does not have a strong effect upon P. maniculatus activity at the weather's peak period (7 days) or the activity's peak period (5 days); the effect of weather upon activity is strongest at 2 days (a minor peak for P. maniculatus activity) and 16 days (a minor peak in weather fluctuation). Since only sundown temperature has an effect at both periods, the P. maniculatus in Quebec were probably responding to temperature, rather than to the other variables that happen to be correlated with temperature at certain periods. At the 2-day period, activity is in phase with sundown temperature and cloud cover and out of phase with barometric pressure. At the 16-day period, sundown temperature and relative humidity lead activity by 90° and temperature drop lags activity by 90°, suggesting activity is responding positively to changes in temperature.
Figure 11 - Power spectra of weather factors at the sand track in Quebec and the correlational contribution of each factor to total nightly activity of Peromyscus maniculatus, Clethrionomys gapperi, and Microtus pennsylvanicus (June to September 1969), based upon unpublished data of R. Bider.
Both species of voles in Quebec, Clethrionomys gapperi and Microtus pennsylvanicus, are more strongly correlated with weather than is P. maniculatus at the same site (Table 2), responding positively to sundown temperature, cloud cover, and relative humidity and negatively to barometric pressure and temperature drop. The regression coefficients (Table 3) indicate that sundown temperature has the strongest effect, a positive one, with some positive effect from cloud cover and negative effect from temperature drop.
The power spectra of all weather factors measured at the Quebec site in 1969 (Figure 11)are similar to each other and to the spectra of the two species of voles (Figure 8). The coherences and resultant effects upon activity are highest at peak periods for weather fluctuations, indicating a strong response of vole activity to weather.
Conclusions
Individuals of all species of Peromyscus that were studied showed pulses of surface activity during the night. There were periods in the middle of the night when the entire population showed less activity, but this was not so distinct because the activities of all individuals were not in synchrony.
The two species of Peromyscus in California were active (off and on) throughout the night, although P. californicus showed relatively more activity at the end of the night. The same pattern persisted throughout the period of observation in California (spring and summer), whereas the time pattern within a night of P. maniculatus in Ontario changed markedly with the season, including a time (late summer) when there was no activity during the second half of the night.
All species of Peromyscus showed marked night-to-night fluctuations with a prominent periodicity at about 4 days. Activity fluctuations from night to night at the California site were in synchrony throughout the population; it is not known whether this was so at the Ontario site.
Voles conformed with the stereotype of high activity on warm, cloudy nights. In contrast, the Peromyscus in California and Quebec were more independent of weather, similar to each other in some ways and different in others. All three species of Peromyscus had a peak periodicity that did not correspond to the peak periodicity in weather. The California Peromyscus were most tightly phased with weather at their own peak periodicity, but the Quebec Peromyscus were most tightly phased at a minor peak of their own. Whereas the California mice were responding positively to high pressure factors, the Quebec mice were responding positively to low pressure factors.
Although the activities of all species of mice held certain features in common, such as fluctuations both during the night and from night to night, the details were different for different species, sites, and years. There were not enough different situations studied to indicate which of these factors has the most influence. However, definite caution is indicated in trying to generalize from a single situation to Peromyscus in general.
Caution also is suggested in drawing sweeping conclusions from trapping data. Electronic detection provides much more reliable and detailed information on time patterns of activity. Transmitters were most effective for monitoring the activities of individuals; and the aluminum tape was most effective for monitoring the entire population.
Additional information on spatial patterns, such as smoked-paper tracking, will be necessary for a deeper understanding of mouse activity. More attention should be given also to what the mice are actually doing, which requires direct observation; and to how they budget their time between various activities. Finally, since both daily fluctuations and seasonal trends in the mouse's environment involve many variables changing in concert, it is difficult to determine from simple observation and correlational analysis which are the actual cues for mice. Only an experimental approach can reveal causal relationships with certainty.
Acknowledgements
Simon Carrier, Gary Stewart, and Kenneth Keagan assisted with the field work in Ontario. Charlene Lindsay (Biometrics Unit, Canadian Forestry Service) did the computer programming. Figures were prepared by the Graphics Unit of the Canadian Forestry Service. Roger Bider (MacDonald College, Quebec) supplied valuable unpublished data from his forest sandtrack in Quebec. Bruce Falls made helpful suggestions on the manuscript.
Particular thanks are due to my academic supervisor, William Lidicker, and to my colleagues in the Canadian Forestry Service, Donald MacLean, Jag Maini, and Peter Rennie, for their continuing support of this work. The initial stages of this project were supported by Atomic Energy Commission Grant no. AT(11-1)-34.
Literature Cited
- AMBROSE, H. W. 1966. An experimental study of some factors affecting the spatial and temporal activity of Microtus pennsylvanicus. Unpublished Ph.D. thesis, Cornell Univ., 81 pp.
- BEHNEY, W. H. 1936. Nocturnal explorations of the forest deer-mouse. J. Mamm., 17:225-230.
- BERGSTEDT, B. 1965. Distribution, reproduction, growth, and dynamics of the rodent species Clethrionomys glareolus (Schreber), Apodemus flavicollis (Melchoir) and Apodemus sylvaticus (Linne) in southern Sweden. Oikos, 16:132-150.
- BIDER, J. R. 1968. Animal activity in uncontrolled terrestrial communities as determined by a sand transect technique. Ecol. Monogr., 38:269-308.
- BLAIR, W. F. 1943. Activities of the Chihuahua deer-mouse in relation to light intensity. J. Wildlife Mgt., 7:92-97.
- _____. 1951. Population structure, social behavior and environmental relations in a natural population of the beach mouse (Peromyscus polionotus leucocephalus). Contrib. Lab. Vert. Biol., Univ. Michigan, 48:1-47.
- BRANT, D. H., AND J. L. KAVANAU. 1965. Exploration and movement patterns of the canyon mouse Peromyscus crinitus in an extensive laboratory enclosure. Ecology, 46:452-460.
- CALHOUN, J. B. 1946. Die1 activity rhythms of the rodents, Microtus ochrogaster, and Sigmodon hispidus hispidus. Ecology, 26:251-273.
- CARLEY, C. J., E. D. FLEHARTY, AND M. A. MARES. 1970. Occurrence and activity of Reithrodontomys megalotis, Microtus ochrogaster, and Peromyscus maniculatus as recorded by a photographic device. Southwestern Nat., 15:209-216.
- CLARKE, F. H. 1936. The estrus cycle of the deer-mouse, Peromyscus maniculatus. Contrib. Lab. Vert. Genetics, Univ. Michigan, 1:l-8.
- DICE, L. R., AND S. A. HOSLETT. 1950. Variation in the spontaneous activity of Peromyscus as shown by recording wheels. Contrib. Lab. Vert. Biol., Univ. Michigan, 47:1-18.
- FALLS, J. B. 1953. Activity and local distribution of deer-mice in relation to certain environmental factors. Unpublished Ph.D. thesis, Univ. Toronto, 168 pp.
- _____. 1968. Activity. Pp. 543-570, in Biology of Peromyscus (Rodentia) (J. A. King, ed.), Spec. Publ., Amer. Soc. Mamm., 2:xiii + 1-593.
- FRENCH, R. L. 1956. Eating, drinking and activity patterns of Peromyscus maniculatus sonoriensis. J. Mamm., 37:74-79.
- GENTRY, J. B., AND E. P. ODUM. 1957. The effect of weather on winter activity of old-field rodents. J. Mamm., 38:72-77.
- GOTTSCHANG, J. L. 1952. A life history study of the deer-mouse Peromyscus leucopus noveboracensis (Fisher) in the Ithaca, New York, region. Unpublished Ph.D. thesis, Cornell Univ.
- GRAHAM, W. J. 1968. Daily activity patterns in the meadow vole, Microtus pennsylvanicus. Unpublished Ph.D. thesis, Univ. Michigan, 108 pp.
- GRANGER, C. W. J., AND M. HATANAKA. 1964. Spectral analysis of economic time series. Princeton Univ. Press, 299 pp.
- HANSSON, L. 1967. Index line catches as a basis of population studies on small mammals. Oikos, 18:261-276.
- HARESIGN, T. W. 1964. A study of the activity of Peromyscus leucopus as influenced by certain environmental factors. Unpublished Ph.D. thesis, Univ. Massachusetts, 86 pp.
- HART, J. S. 1953. Energy metabolism of the white footed mouse, Peromyscus leucopus noveboracensis, after acclimation at various environmental temperatures. Canadian J. Zool., 31:99-105.
- HEDIGER, H. 1950. Wild animals in captivity. Butterworths, London, 207 pp.
- ISAAC, D. E. 1967. Temporal organization of activities in deer mice, Peromyscus maniculatus. Unpublished Ph.D. thesis, Univ. California, Berkeley, 109 pp.
- JENKINS, G. M., AND D. G. WATTS. 1968. Spectral analysis and its applications. Holden-Day, San Francisco, 525 pp.
- JOHNSON, M. S. 1939. Effect of continuous light on periodic spontaneous activity of white-footed mice (Peromyscus). J. Exp. Zool., 82:315-328.
- KAVANAU, J. L. 1962. Precise monitoring of drinking behaviour in small animals. J. Mamm., 43:345-351.
- KAVANAU, J. L., AND C. E. RISCHER. 1968. Program clocks in small mammals. Science, 161:1256-1259.
- KIKKAWA, J. 1964. Movements, activity and distribution of the small rodents Clethrionomys glareolus and Apodemus sylvaticus in woodland. J. Anim. Ecol., 33:259-299.
- MARTEN, G. G. 1970. The remote-sensing approach to censusing deer mice and monitoring their activity. Unpublished Ph.D. thesis, Univ. California, Berkeley, 204 pp.
- _____. 1972. The remote sensing approach to censusing. Res. Pop. Ecol., 14:36-57.
- MILSUM, J. H. 1966. Biological control systems analysis. McGraw-Hill, New York, 466 pp.
- MOTT, D. G. 1966. The analysis of determination in population systems. In Systems analysis in ecology (K. Watt, ed.), Academic Press, New York, 276 pp.
- ORR, H. D. 1959. Activity of white-footed mice in relation to environment. J. Mamm., 40:213-221.
- OWINGS, D. H., AND R. B. LOCKARD. 1971. Different nocturnal activity patterns of Peromyscus californicus and Peromyscus eremicus in lunar lighting. Psychonomic Sci. Sect., Anim. Physiol. Psych., 22:63-64.
- PEARSON, O. P. 1959. A traffic survey of Microtus-Reithrodontomys runways. J. Mamm., 40:169-180.
- SIDOROWICZ, J. 1960. Influence of the weather on capture of micro-mammalia, I. Rodents. Acta Theriologica, 4:139-158.
- SIEGEL, S. 1956. Nonparametric statistics for the behavioral sciences. McGraw-Hill, New York, 312 pp.
- STICKEL, L. F. 1968. Home range and travels. Pp. 373-411, in Biology of Peromyscus (Rodentia) (J. A. King, ed.), Spec. Publ., Amer. Soc. Mamm., 2:xiii + 1-593.
- STINSON, R. H. 1952. Effects of some environmental factors on the behavior of Peromyscus. Unpublished Ph.D. thesis, Univ. Toronto.
- TANTON, M. T. 1965. Problems of live trapping and population estimation for the wood mouse, Apodemus sylvaticus (L.). J. Anim. Ecol., 34:l-22.
- THIBAULT, P. 1969. Activite estivale de petits mammiferes du Quebec. Canadian J. Zool., 47:817-828.
- Museum of Vertebrate Zoology, University of California, Berkeley, 94720, and Canadian Forestry Service, Petawawa Forest Experiment Station, Chalk River, Ontario, Canada (present address: East African Freshwater Fisheries Organization, P.O. Box 343, Jinja, Uganda). Accepted 17 April 1972.
Appendix
Spectral time-series analyses followed the procedures outlined in Jenkins and Watts (1968, sections 7.1.1and 9.3.1). The description below is intended to document the computations leading to Figures 7-11. The reader is referred to Milsum (1966:382-392)for a brief and intuitive explanation of lagged correlation coefficients and power spectral densities.
The finite Fourier transform of the lagged cross correlation coefficients (rij) gives the in-phase co-spectrum (Fij) and the 90° out-of-phase quadrature spectrum (Qij):

where T is the length of the series and k is the amount of lag,
where P is the period and K is the number of lags. (K was set at T/2). W is the Parzen weighting function:
The off-diagonal of spectral amplitude (Aij) is the co-spectral density, which corresponds to covariance in time-domain; the diagonal (Aii)is the power spectral density, which corresponds to variance; coherence (Cij)is the proportion of the fluctuations of two series which are in the same phase with each other, which corresponds to r2; and phase (θij)is the amount one series i lags behind the other j (one period = 360°).

In Figures 9and 11, the period-specific contribution of a weather factor j to activity i was computed as the product Cij(P) · Aii(P).
Since spectral analysis assumes a stationary time series (that is, constant statistical parameters for the duration of the series), any long-term trends were removed by fitting a third-degree polynominal to each series and subjecting only the residuals about the polynomial to spectral analysis, as outlined by Granger and Hatanaka (1964, section 8.3). This was particularly important for mouse activity because the number of mice in the area could change through successive weeks.
Linked Citations
Nocturnal Explorations of the Forest Deer-Mouse - W. H. Behney
Journal of Mammalogy, Vol. 17, No. 3. (Aug., 1936), pp. 225-230.
Stable URL:
http://links.jstor.org/sici?sici=0022-2372%28193608%2917%3A3%3C225%3ANEOTFD%3E2.0.CO%3B2-U
Animal Activity in Uncontrolled Terrestrial Communities as Determined by a Sand Transect Technique - J. Roger Bider
Ecological Monographs, Vol. 38, No. 4. (Autumn, 1968), pp. 269-308.
Stable URL:
http://links.jstor.org/sici?sici=0012-9615%28196823%2938%3A4%3C269%3AAAIUTC%3E2.0.CO%3B2-J
Exploration and Movement Patterns of the Canyon Mouse Peromyscus Crinitus in an Extensive Laboratory Enclosure - Daniel H. Brant; J. Lee Kavanau
Ecology, Vol. 46, No. 4. (Jul., 1965), pp. 452-461.
Stable URL:
http://links.jstor.org/sici?sici=0012-9658%28196507%2946%3A4%3C452%3AEAMPOT%3E2.0.CO%3B2-8
Diel Activity Rhythms of the Rodents, Microtus Ochrogaster and Sigmodon Hispidus Hispidus - John B. Calhoun
Ecology, Vol. 26, No. 3. (Jul., 1945), pp. 251-273.
Stable URL:
http://links.jstor.org/sici?sici=0012-9658%28194507%2926%3A3%3C251%3ADAROTR%3E2.0.CO%3B2-K
Eating, Drinking, and Activity Patterns in Peromyscus maniculatus sonoriensis - Robert L. French
Journal of Mammalogy, Vol. 37, No. 1. (Feb., 1956), pp. 74-79.
Stable URL:
http://links.jstor.org/sici?sici=0022-2372%28195602%2937%3A1%3C74%3AEDAAPI%3E2.0.CO%3B2-W
The Effect of Weather on the Winter Activity of Old-Field Rodents - John B. Gentry; Eugene P. Odum
Journal of Mammalogy, Vol. 38, No. 1. (Feb., 1957), pp. 72-77.
Stable URL:
http://links.jstor.org/sici?sici=0022-2372%28195702%2938%3A1%3C72%3ATEOWOT%3E2.0.CO%3B2-B
Precise Monitoring of Drinking Behavior in Small Mammals - J. Lee Kavanau
Journal of Mammalogy, Vol. 43, No. 3. (Aug., 1962), pp. 345-351.
Stable URL:
http://links.jstor.org/sici?sici=0022-2372%28196208%2943%3A3%3C345%3APMODBI%3E2.0.CO%3B2-1
Program Clocks in Small Mammals - J. Lee Kavanau; Carl E. Rischer
Science, New Series, Vol. 161, No. 3847. (Sep. 20, 1968), pp. 1256-1259.
Stable URL:
http://links.jstor.org/sici?sici=0036-8075%2819680920%293%3A161%3A3847%3C1256%3APCISM%3E2.0.CO%3B2-R
Movement, Activity and Distribution of the Small Rodents Clethrionomys glareolus and Apodemus sylvaticus in Woodland - Jiro Kikkawa
The Journal of Animal Ecology, Vol. 33, No. 2. (Jun., 1964), pp. 259-299.
Stable URL:
http://links.jstor.org/sici?sici=0021-8790%28196406%2933%3A2%3C259%3AMAADOT%3E2.0.CO%3B2-K
Activity of White-Footed Mice in Relation to Environment - Howard D. Orr
Journal of Mammalogy, Vol. 40, No. 2. (May, 1959), pp. 213-221.
Stable URL:
http://links.jstor.org/sici?sici=0022-2372%28195905%2940%3A2%3C213%3AAOWMIR%3E2.0.CO%3B2-K
A Traffic Survey of Microtus-Reithrodontomys Runways - Oliver P. Pearson
Journal of Mammalogy, Vol. 40, No. 2. (May, 1959), pp. 169-180.
Stable URL:
http://links.jstor.org/sici?sici=0022-2372%28195905%2940%3A2%3C169%3AATSOMR%3E2.0.CO%3B2-G
Problems of Live-Trapping and Population Estimation for the Wood Mouse, Apodemus sylvaticus (L.) - M. T. Tanton
The Journal of Animal Ecology, Vol. 34, No. 1. (Feb., 1965), pp. 1-22.
Stable URL:
http://links.jstor.org/sici?sici=0021-8790%28196502%2934%3A1%3C1%3APOLAPE%3E2.0.CO%3B2-E